


Phone Call Answer Rates by State (2026): Who Picks Up When a Store Calls
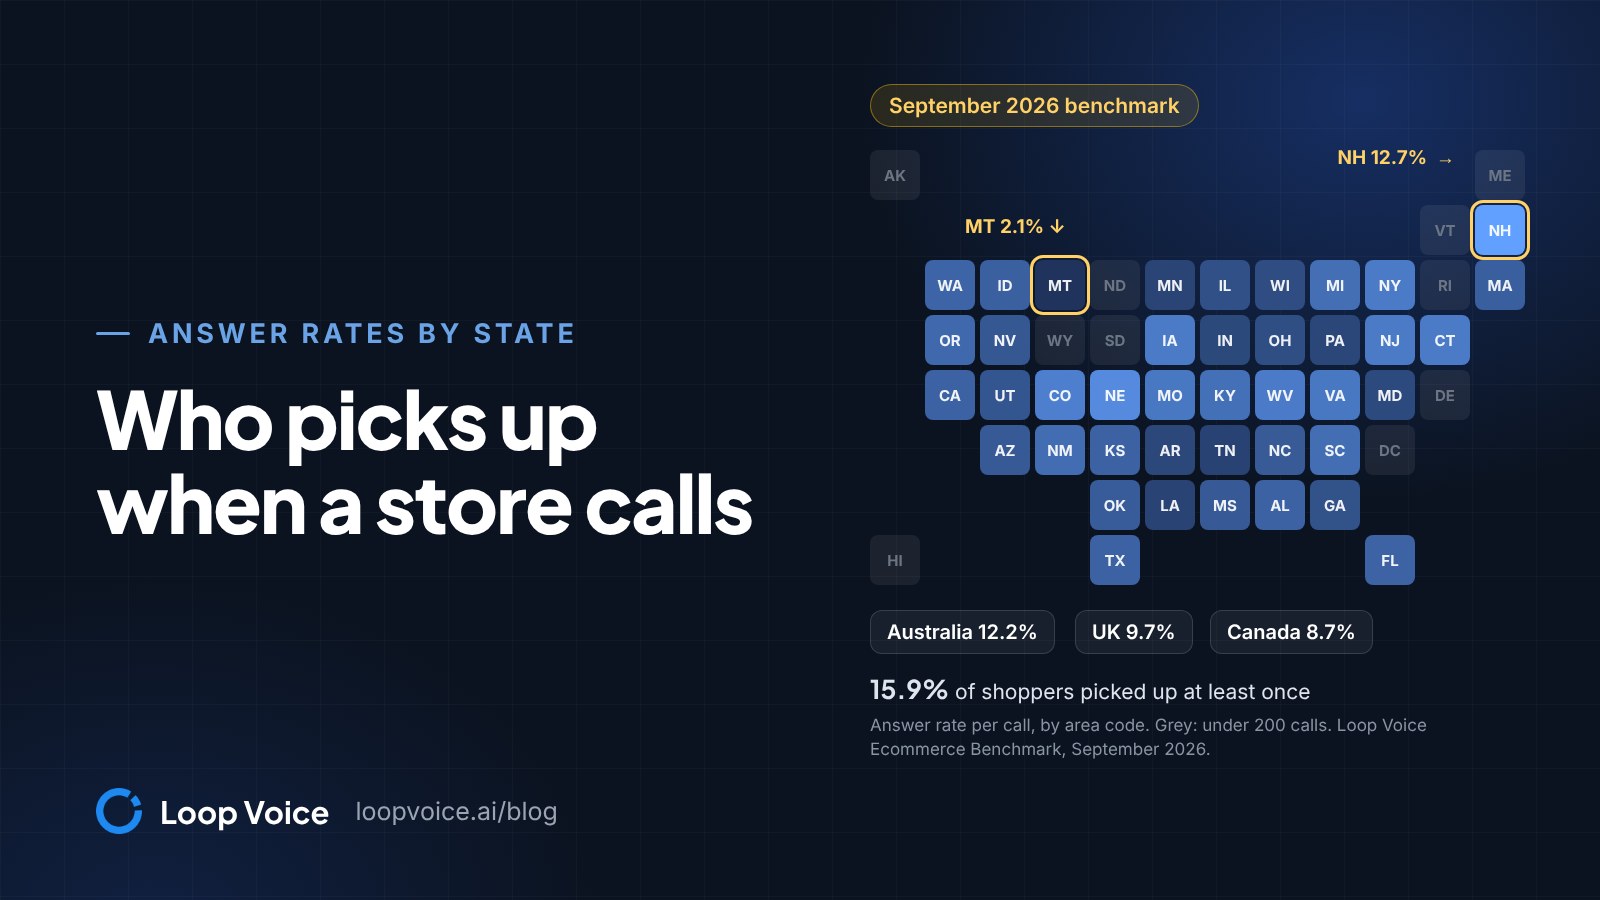
Shoppers in New Hampshire picked up store calls most often and shoppers in Montana least often in Loop Voice's September 2026 benchmark. The full table for 41 states plus Australia, the UK and Canada, how an answer is counted, and what the gaps do and don't mean.

Key takeaways
- In September 2026, 15.9% of the shoppers online stores called picked up at least once, and 6.6% of individual calls were answered by a person.
- Answer rates per call ran from 2.1% in Montana to 12.7% in New Hampshire; among large states, New York (9.0%) and Pennsylvania (4.0%) were furthest apart.
- For 19 of the 41 published states, the 95% interval includes the 6.6% average, so plan from expected pickups, not from a state's rank.
Answer rates at a glance
In Loop Voice's September 2026 benchmark, 15.9% of the shoppers that online stores called picked up at least once, and 6.6% of individual calls were answered by a person. Answer rates per call ranged from 2.1% in Montana to 12.7% in New Hampshire, and outside the US, Australia led at 12.2%, ahead of the United Kingdom (9.7%) and Canada (8.7%).
| Measure | Answer rate | Based on |
|---|---|---|
| Shoppers who picked up at least once | 15.9% (95% CI 15.4 to 16.4) | 18,361 shoppers |
| All calls | 6.6% | 61,389 calls |
| Highest US state: New Hampshire | 12.7% (9.2 to 17.3) | 258 calls |
| Lowest US state: Montana | 2.1% (0.9 to 4.6) | 267 calls |
| Australia | 12.2% (9.3 to 15.9) | 384 calls |
| United Kingdom | 9.7% (6.6 to 14.0) | 253 calls |
| Canada | 8.7% (6.3 to 11.9) | 396 calls |
The source is the Loop Voice Ecommerce Benchmark, September 2026: calls from 7 online stores to shoppers who had started a checkout or placed an order, about 98% of them to US numbers. Loop Voice ran these calls for the stores and publishes the report, which is free to reuse with credit under CC BY 4.0.
What counts as an answered call
A call counts as answered only when a person picks up. In the report's words, "voicemail and call screening do not count," which keeps these rates below figures that count any connection.
The benchmark reports two rates from the same calls:
- Answer rate per shopper: shoppers where a person picked up at least once, divided by shoppers contacted. That is the 15.9%.
- Answer rate per call: answered calls divided by every call placed, second calls included. That is the 6.6%, and the rate behind the state, country and hour tables.
The gap between the two is repeat attempts. The stores placed 61,389 calls to 18,361 shoppers, about 3.3 calls each, and every attempt that rings out lowers the per-call rate.
Phones also screen calls before anyone answers. On an iPhone set to Ask Reason for Calling, "the caller is asked why they're calling before your phone even rings" (Apple Support), and on Pixel 7 and newer phones in the US, Canada, the UK, Ireland and Australia, Call Screen can answer first-time callers automatically (Google Phone app Help). When the phone's assistant takes the call and the shopper never does, the benchmark counts it as unanswered.
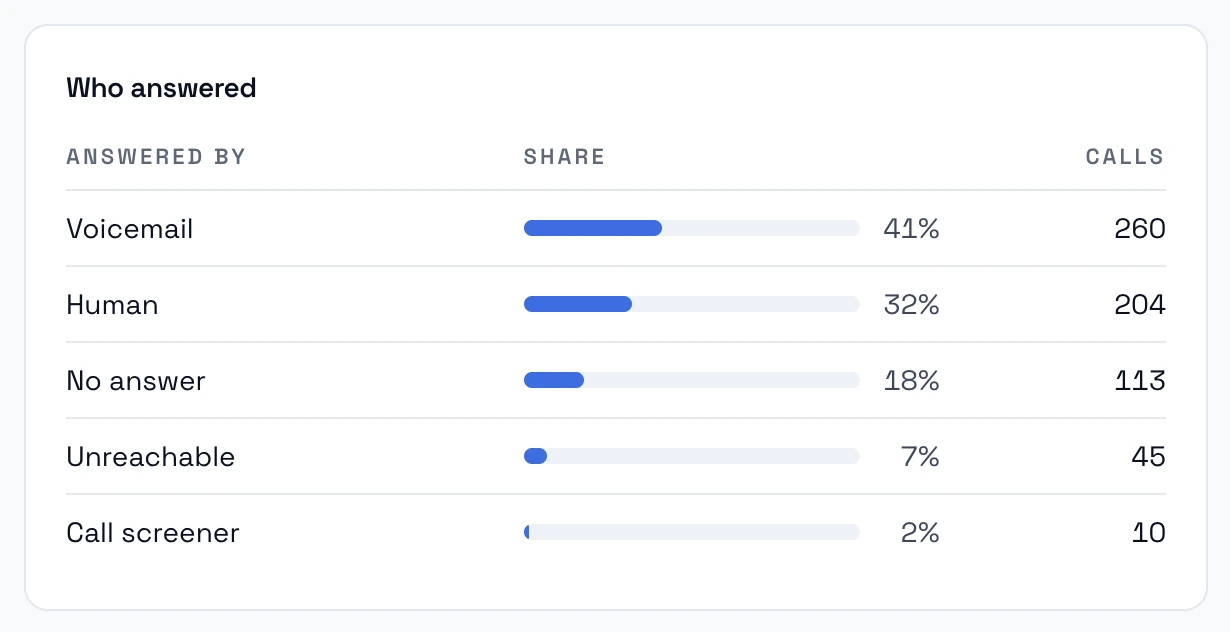
Loop Voice's Insights breaks calls down by who answered, so a store can see whether its misses are voicemail, screening or unreachable numbers before it changes anything else.
Answer rate by state
Each state below comes from the area code of the shopper's phone number. Rates are per call, with the 95% interval and the number of calls behind each one.
| State | Calls | Answered (%) | 95% interval |
|---|---|---|---|
| Alabama | 1,197 | 6.7 | 5.4 to 8.3 |
| Arizona | 836 | 5.9 | 4.5 to 7.7 |
| Arkansas | 758 | 4.1 | 2.9 to 5.8 |
| California | 5,122 | 6.7 | 6.0 to 7.4 |
| Colorado | 803 | 9.5 | 7.7 to 11.7 |
| Connecticut | 384 | 9.0 | 6.5 to 12.3 |
| Florida | 3,387 | 6.8 | 6.0 to 7.7 |
| Georgia | 1,704 | 5.1 | 4.2 to 6.2 |
| Idaho | 274 | 6.5 | 4.1 to 10.1 |
| Illinois | 3,993 | 4.9 | 4.3 to 5.6 |
| Indiana | 2,432 | 4.2 | 3.5 to 5.1 |
| Iowa | 538 | 9.0 | 6.9 to 11.7 |
| Kansas | 573 | 6.7 | 4.9 to 9.0 |
| Kentucky | 1,126 | 8.0 | 6.6 to 9.7 |
| Louisiana | 2,016 | 3.7 | 3.0 to 4.6 |
| Maryland | 1,002 | 4.3 | 3.2 to 5.7 |
| Massachusetts | 809 | 6.4 | 4.9 to 8.3 |
| Michigan | 2,042 | 7.9 | 6.8 to 9.2 |
| Minnesota | 1,702 | 3.8 | 3.0 to 4.8 |
| Mississippi | 800 | 5.9 | 4.5 to 7.8 |
| Missouri | 1,357 | 8.8 | 7.4 to 10.4 |
| Montana | 267 | 2.1 | 0.9 to 4.6 |
| Nebraska | 316 | 10.6 | 7.7 to 14.5 |
| Nevada | 475 | 5.6 | 3.9 to 8.0 |
| New Hampshire | 258 | 12.7 | 9.2 to 17.3 |
| New Jersey | 1,175 | 9.0 | 7.5 to 10.8 |
| New Mexico | 306 | 7.7 | 5.2 to 11.2 |
| New York | 3,498 | 9.0 | 8.1 to 10.0 |
| North Carolina | 1,927 | 6.0 | 5.0 to 7.2 |
| Ohio | 3,028 | 4.7 | 4.0 to 5.5 |
| Oklahoma | 899 | 6.1 | 4.7 to 7.9 |
| Oregon | 787 | 7.3 | 5.7 to 9.3 |
| Pennsylvania | 2,761 | 4.0 | 3.3 to 4.8 |
| South Carolina | 1,322 | 7.8 | 6.5 to 9.4 |
| Tennessee | 1,344 | 3.6 | 2.7 to 4.7 |
| Texas | 5,723 | 6.7 | 6.1 to 7.4 |
| Utah | 334 | 5.5 | 3.5 to 8.5 |
| Virginia | 1,220 | 8.8 | 7.3 to 10.5 |
| Washington | 899 | 6.9 | 5.4 to 8.7 |
| West Virginia | 464 | 9.1 | 6.8 to 12.1 |
| Wisconsin | 763 | 4.6 | 3.3 to 6.3 |
Source: Loop Voice Ecommerce Benchmark, September 2026; 60,621 calls across the 41 published states. Not published, with fewer than 200 calls each: Alaska, Delaware, the District of Columbia, Hawaii, Maine, North Dakota, Rhode Island, South Dakota, Vermont and Wyoming.
New Hampshire (12.7%) and Nebraska (10.6%) topped the table, followed by Colorado, West Virginia and four states at 9.0%: Connecticut, Iowa, New Jersey and New York. Montana (2.1%) was last, behind Tennessee (3.6%), Louisiana (3.7%), Minnesota (3.8%) and Pennsylvania (4.0%).
Where the numbers are firmest
Seven states had more than 2,500 calls each, enough for tight intervals. New York (9.0%, interval 8.1 to 10.0) and Pennsylvania (4.0%, 3.3 to 4.8) sit at opposite ends, and their intervals don't overlap. Texas and California both came in at 6.7%, Florida at 6.8%, Illinois at 4.9% and Ohio at 4.7%.
On this month's data, a store whose shoppers cluster in Illinois, Ohio and Pennsylvania should plan for a per-call answer rate below the 6.6% average, and one strong in New York and New Jersey for a rate above it.
Why one state answers more than another
The table shows where answer rates differed, not why, and part of the spread is chance. These four effects are the ones the data and outside research support:
- Small samples make the extremes. The top and bottom states are among the smallest: New Hampshire rests on 258 calls and Montana on 267, with 95% intervals of 9.2 to 17.3 and 0.9 to 4.6. For 19 of the 41 states, the interval includes the 6.6% average, so their place in any ranking is mostly noise.
- An area code is not an address. Pew Research Center found that about 10% of US adults have a cellphone number tied to a different state than the one they live in, and 21% in New Hampshire, from more than 32,000 cellphone survey respondents in 2013 to 2015. Some calls filed under one state likely reached people living in another.
- Seven stores' customers, not a census. Each row holds the shoppers of seven online stores whose numbers carry that state's area codes, not a sample of residents. The report caps any one store at 15% of a figure, but what those stores sell, and to whom, still shapes each row.
- Retries pull the per-call rate down. A state where more shoppers needed a second or third attempt shows a lower per-call rate even if the same share eventually picked up. The benchmark doesn't publish per-shopper rates by state, so the two effects can't be separated here.
What the data can't tell you is whether age, spam volume, carrier labels or local habits explain the gaps. None of those are in the data file, and we haven't tested them.
How this compares with other answer-rate statistics
The answer-rate figures quoted most often are about unknown callers in general, not a store calling its own shoppers:
- Pew Research Center's July 2020 survey of 10,211 US adults found that eight in ten don't generally answer their cellphone when an unknown number calls, while 19% say they do. Adults 18 to 29 were more likely to pick up.
- Hiya's State of the Call 2026 reports that 86% of unknown calls go unanswered, drawing on 12,000+ consumers in 6 countries.
The benchmark counts calls from call records, and on the closest matching measures it comes in lower. Per call, 6.6% were answered, well under the 14% that Hiya's figure leaves answered; per shopper, across about three attempts, 15.9% picked up at least once, still short of the 19% in Pew's survey who say they answer. And these calls weren't cold: every shopper had started a checkout or placed an order with the store, yet about five in six never picked up.
What a store should do with these numbers
Use the table to plan, not to choose whom to call. Dropping a low-answer state would cut off shoppers who agreed to hear from you over nothing more than their area code.
- Plan credits from pickups, not dials. Example: 1,000 calls to New York numbers at 9.0% would produce about 90 answered calls, and 1,000 calls to Pennsylvania numbers at 4.0% about 40. Loop Voice uses credits only when a customer picks up, about 1.5 per answered conversation.
- Let the text carry the low-answer states. Where fewer people pick up, more shoppers only ever see your follow-up text, so its wording matters more. Our guide to the text after a missed call covers what to send.
- Don't chase a low rate with extra calls. Loop Voice places at most 3 outbound calls per customer in 24 hours across all flows and campaigns, and Florida caps sales calls on one subject at three per person in any 24 hours, whatever number they come from (Florida Statutes 501.616(6)). Our TCPA guide covers consent and other states' limits.
- Fix the hour before the state. The same benchmark shows weekday evening calls answered more often than morning ones (7.0% against 5.4%), and our guide to the best time to call customers breaks that down by hour.
- Compare like with like. Hold your rate against the benchmark's 6.6% per call or 15.9% per shopper, not a dialer's connect rate. For abandoned checkouts alone, 16.5% of 14,036 shoppers picked up at least once, as the abandoned checkout page reports.
- Add countries one at a time. Australia, the UK and Canada all came in above the 6.6% average in September, though on only 253 to 396 calls each. Calling rules differ by country and the TCPA guide covers only the US, so get local advice before you dial.
How to cite this data
The benchmark is free to quote and reuse with attribution under CC BY 4.0. Cite it as: Loop Voice Ecommerce Benchmark, September 2026. Loop Voice. loopvoice.ai/benchmarks/2026-09.
The report's CSV and JSON files carry every rate with its n and 95% interval, and new monthly issues appear on the benchmarks page. Keep the interval next to any state figure built on fewer than 500 calls; it is often wider than the gap you want to report.
Frequently asked questions
What is the average answer rate when an online store calls its shoppers?
In Loop Voice's September 2026 benchmark, 6.6% of calls were answered by a person and 15.9% of shoppers picked up at least once. For abandoned-checkout calls alone, 16.5% of shoppers picked up at least once. Voicemail and screened calls are not counted as answered.
Which US state had the highest phone answer rate in 2026?
In Loop Voice's September 2026 benchmark, New Hampshire, with 12.7% of calls answered, followed by Nebraska at 10.6%. They rest on only 258 and 316 calls, so their intervals are wide (95% CI 9.2 to 17.3 for New Hampshire). Among large states, New York led at 9.0% on 3,498 calls.
Which state had the lowest answer rate?
Montana, at 2.1% of 267 calls (95% CI 0.9 to 4.6). Tennessee (3.6%), Louisiana (3.7%) and Minnesota (3.8%) came next, each on more than 1,300 calls, so their low rates are firmer than Montana's.
Does a voicemail count as an answered call in these statistics?
No. The benchmark counts a call as answered only when a person picks up. Voicemail and call screening, such as an iPhone asking the caller's reason before it rings, both count as unanswered.
Can I use these answer rates in my own article or report?
Yes. The benchmark is free to quote and reuse with attribution under CC BY 4.0. Cite it as Loop Voice Ecommerce Benchmark, September 2026, Loop Voice, loopvoice.ai/benchmarks/2026-09, and keep each rate's sample size and interval with it where you can.
Sources
- Loop Voice Ecommerce Benchmark, September 2026 (Loop Voice, 2026)
- Deed: Attribution 4.0 International (Creative Commons, 2026)
- Manage unknown callers on iPhone (Apple Support, 2026)
- Screen your calls before you answer them (Google Phone app Help, 2026)
- Moving Without Changing Your Cellphone Number: A Predicament for Pollsters (Pew Research Center, 2016)
- Most Americans don't answer cellphone calls from unknown numbers (Pew Research Center, 2020)
- State of the Call 2026 (Hiya, 2026)
- 501.616 Unlawful acts and practices, 2026 Florida Statutes (The Florida Senate, 2026)
- Pricing (Loop Voice, 2026)
Hear it before you decide
Listen to real recovery calls, or see Loop Voice call a test checkout on your own store.